Introduction

Background and History
This project acknowledges the historical and contemporary presence of indigenous communities across the state of Colorado, including Ute, Cheyenne, Arapahoe, Navajo, and Comanche Nations.
Colorado's later settlers arrived near the end of the 19th century during the Gold Rush, which prompted a rapid influx of prospectors drawn by the discovery of valuable minerals throughout the Rocky Mountains. This boom led to the founding of towns and cities across the Front Range, many of which remain today as the largest population centers in the state, including Denver and Colorado Springs.
Denver is now the largest metropolitan area in the state with a population of 715,000 people, followed by Colorado Springs to the south and Fort Collins to the North.
These cities feature many hallmarks of urban development including higher population densities, higher incomes, and a high prevalence of polluting facilities (especially industrial manufacturing and waste management sites). Many smaller towns and rural areas across the state also experience environmental hazards which are often related to extractive industries like mining and oil or gas production.
This atlas seeks to visualize the types of pollution and environmental hazards experienced by populations across the state and to explore the relationship between population characteristics and the disproportionate impact of polluting and hazardous facilities on specific communities.
Environmental Justice
The uneven distribution of pollution sources among different communities is a pressing environmental concern. Low-income communities of color often bear the heaviest burden of exposure to environmental hazards and pollution due to living in close proximity to higher densities of pollution sources like industrial manufacturing facilities, power plants, and waste disposal sites. Colorado has enacted various legislative and regulatory initiatives intended to address environmental inequities, and Colorado's Department of Public Health and Environment (CDPHE) maintains a mapping tool called EnviroScreen which plays a large role in these efforts.
EnviroScreen identifies Disproportionately Impacted Communities (DIC) at the census block group level and includes a wide variety of data related to pollution, environmental hazards, demographics, and public health. Identification of DIC using this data provides a visualization of the severity of environmental and health hazards faced by different communities across the state.

Demographic Indicators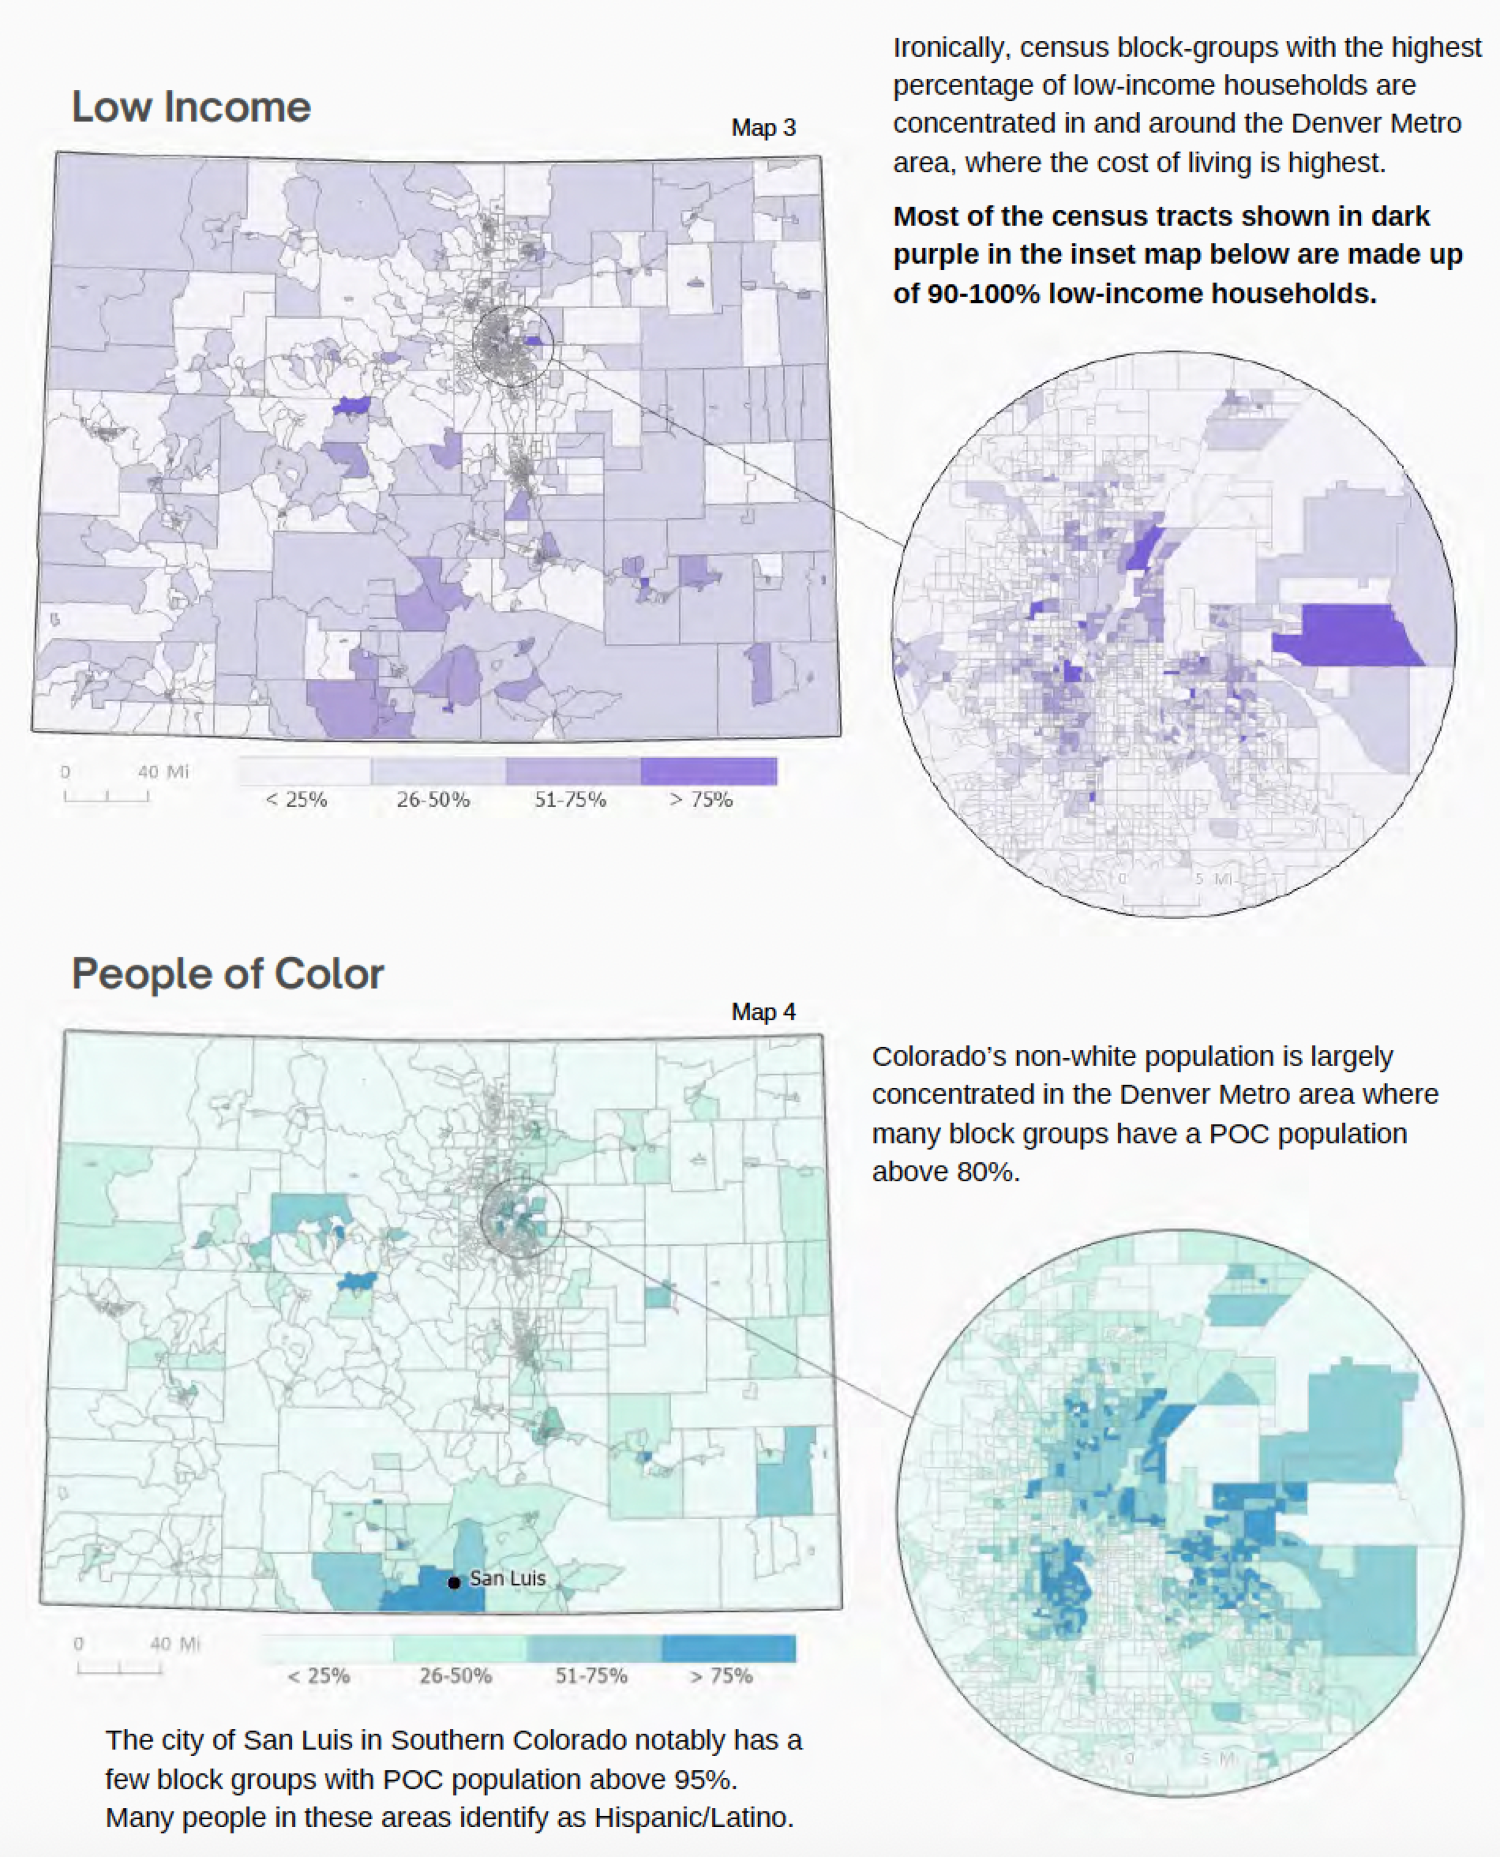


Pollution Impacts: Air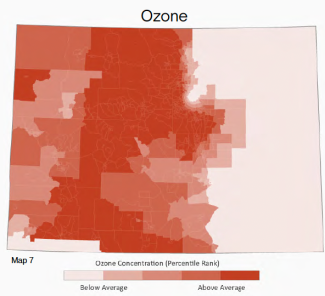

Ozone
Ozone is an extremely reactive form of oxygen that forms chemical reactions between other air pollutants in the presence of sunlight. Ozone levels vary over time, but its concentration is often highest in urban areas with heavy vehicle emissions and industrial processes and in low-lying valleys.
Ozone can cause direct harm to respiratory system tissues and is associated with asthma attacks and cardiovascular disease.
Map 7 shows the maximum values of 8-hour average ozone concentration predictors modeled by the EPA using data from air quality monitors around the state.
Fine Particulate Pollution (PM2.5)
PM2.5 refers to any particulate matter in the air with a diameter less than 2.5 micrometers that is capable of harming respiratory tissues. These particles come from many sources including vehicle tailpipes, smokestacks, fires, dust from construction sites, and chemical reactions in the atmosphere.
PM2.5 is the air pollutant associated with the largest health burden worldwide. Due to their small size, they can be inhaled and pass through the respiratory tract into the blood and organ system. PM2.5 is associated with myriad health outcomes including respiratory and cardiovascular disease and cancer (CDPHE).
Map 8 shows the 24-hour average predicted values of PM2.5 concentration modeled from state and local air quality data.
Pollution Impacts: Water
Wastewater Contamination
Many chemicals can affect water quality and pose risks to human and environmental health. Map 9 shows a statewide comparison of wastewater toxicity as measured by discharge from EPA-monitored Toxic Release Inventory (TRI) facilities.
This monitoring program tracks 700+ chemicals that can impact human health and may lead to development of chronic disease (especially metabolic, endocrine, and respiratory) and cancer. Exposure may occur directly in the case of ingestion of or dermal contact with contaminated water, or indirectly via consumption of contaminants transferred from water to the food chain.

Map 9 shows the estimated toxic chemical concentrations in stream segments from EPA-regulated Toxic Release Inventory (TRI) facilities. Mandatory monitoring of these facilities includes the amount of toxic waste emitted along with chemical fate, transport through the environment, relative toxicity, and potential human exposure.
Most water contamination occurs via wastewater discharge from facilities handling toxic chemicals, but not always. Grand Lake (shown in dark blue at top left of Map 9) has been extremely polluted by the Colorado-Big Thompson Project (C-BT) which moves water through the lake before pumping it under the Continental Divide where it serves over 1 million residents and farmers. During the pumping process, algae and sediments are carried into the lake, clouding the water and causing weed growth and toxic algal blooms.
Impaired Streams and Rivers
Streams and rivers in southwestern Colorado (shown in Map 10b) have more water quality issues than other areas of the state. The Rio Grande experiences reduced and regulated flow along with high salt and bacteria levels (E. coli) and high concentrations of agricultural chemicals and industrial wastes. The Lower Arkansas Basin (including Arkansas, Purgatoire and Huerfano Rivers) experiences issues like sedimentation and contamination from radioactive materials, with some rivers in this area testing high for radium, up to 62 times the recommended levels. Residents of this area often experience issues with drinking water like discoloration, odor, and poor taste. As many as two dozen rivers in this area are in violation of the Clean Water Act (NPS, CPR, EPA).

Pollution Impacts: Energy
Proximity to Oil and Gas
Oil and gas are major industries in Colorado and the facilities that support the energy industry often are serious polluters. Power plants and oil and natural gas refineries emit pollutants that can harm human and environmental health including particulate matter, heavy metals, and other air toxics like sulfur dioxide, nitrogen oxides, and volatile organic compounds (VOCs). These pollutants have been associated with health impacts like respiratory and cardiovascular disease, neurological disorder, pregnancy issues, and cancer (CDPHE, EPA).

Map 11 shows a statewide ranking of proximity to oil and gas sites. The ranking was derived by summing all points representing locations of active oil and gas locations, pits, and tanks.
The Suncor oil refinery in Commerce City is notorious for its abundant toxic emissions including air and water pollution that have led to serious health and environmental impacts in the area. Numerous lawsuits have been filed due to Suncor’s noncompliance with emissions violating EPA and state regulations, spewing benzene, sulfur dioxide, and other carcinogenic compounds into neighboring communities which experience numerous health impacts including cancer and respiratory disease (CDPHE, EPA).
Proximity to Mining
Similar to oil and gas, mining is a major energy industry in Colorado. Mining activities can contribute to air, water, and soil pollution and pose risks to human and environmental health. These activities often release harmful substances into surrounding environment like arsenic, lead, mercury, manganese, and silica, which can contaminate agricultural products and water sources. Heavy metals are persistent in ecosystems and once soils are contaminated, they quickly increase in concentration via biomagnification along the food chain. Heavy metal exposure is associated with respiratory disease and increased rates of cancer (CDPHE, EPA).

Map 12 shows a statewide ranking of proximity to mining sites. The ranking was derived by summing all points representing locations of active permits for coal, hard rock, and construction material (e.g., sand, gravel) mining.
Coal has been central to Colorado’s growth and economy since the mid 1800s. With recent concerns about greenhouse gas emissions from coal-fired power plants, many are being shut down, and the era of coal in Colorado is approaching an end. Colorado has created an Office of Just Transition to assist workers and communities reliant on coal in transitioning to new jobs in the natural gas and renewable energy sectors to support a cleaner energy economy.
Pollution Impacts: Environmental Hazards
TSCA & RMP Facilities
Toxic Substances Control Act (TSCA) facilities are places or entities regulated by the U.S. EPA under the Toxic Substances Control Act of 1976. TSCA facilities deal with a wide range of chemicals, and the EPA ensures that they follow safety and environmental regulations to protect both public health and the environment from the potential hazards associated with these substances.
Response Management Plan (RMP) facilities are similar to TSCA facilities and are also required to have a plan in case of an accidental release of hazardous substances. These facilities handle or store chemicals that, if accidentally released, could pose risks to the environment and public safety.
Some examples of TSCA and RMP facilities include:
- Chemical manufacturing plants, importers/exporters, storage, and distribution centers
- Research and development labs
- Waste recycing, treatment, and disposal facilities
- Oil refineries and petrochemical facilities
- Food processing facilities

Map 13 shows a statewide ranking of proximity to hazardous waste facilities (EPA TSCA sites). The ranking was calculated by summing the number of TSCA sites within 5km.
Note: this method gives a good sense of the concentration of sites, but the associated pollutants often travel farther than 5km, so pollution and health impacts are not limited to 5km or the geographies shown in Map 11.
Geographic Weighted Regression
Geographic weighted regression (GWR) is a modified type of regression that examines the relationship between two variables in a more location-specific way.
Regular linear regression treats all locations the same, assuming that the relationship is constant everywhere. However, in reality, the strength and nature of this relationship can vary from place to place. GWR takes this into account by examining how the relationship changes based on location. It does this by assigning different weights to nearby data points, so that data from closer locations have more influence on the analysis. This helps us uncover local variations and trends that might be hidden in traditional regression models.
GWR and Environmental Justice
While there has been much research investigating the dynamics of vulnerable communities and environmental hazards, one area of debate is the directionality of these relationships: are polluting facilities more often built in close proximity to already-disadvantaged communities, or are vulnerable people more likely to move or live in areas that have a high concentration of polluting facilities?
The following analysis attempts to answer this question by investigating the spatial relationships between pollution sources and disadvantaged communities in Colorado. A geostatistical modeling method known as geographic weighted regression is used to model the strength of association between variables related to the prevalence of polluting facilities and demographic indicators at the census-block group level.
Demographic Indicators
Four demographic variables measured at the census block-group level were used to evaluate characteristics of communities in close proximity to polluting facilities. These variables are shown in Maps 3-6 on pages 6 and 7.
- People of Color
- Low Income
- Housing Cost Burden
- Linguistic Isolation
Polluting Facilities
Along with the demographic indicators outlined above, the analysis utilized the point locations of polluting facilities to quantify proximity and exposure to pollution. To account for diverse environmental issues faced by urban and rural communities across the state, polluting facilities were grouped into two categories:
- Energy: oil and gas wells, power plants, oil refineries, natural gas processing plants, ethanol plants
- Environmental Hazards: solid waste facilities, wasstewater treatment plans, TSCA facilities, RMP facilites
Interpreting Results
GWR produces output statistics that can be used to evaluate model fit. These include:
- Local R2: measures local regression model fit to empirical data
- Coefficient: measures strength of independent variable’s influence on dependent variable
- Standard Residuals: measures local over-or under-prediction of the model compared to empirical data
Local R2 values were considered prior to other statistics. An R2 value of 1.0 indicates a “perfect” model fit where all variation in the dependent variable is explained by the independent variable.
GWR Results

Models 1.1 and 1.2 treated demographic indicators as the independent variable and the location of polluting facilities as the dependent variable. Model 1.1 resulted in extremely low negative R2 values ranging to values moderately close to 1, and Model 1.2 resulted in a very small range of R2 values very close to 0. These ranges of R2 values indicates a poor model fit so the models were not considered further.
Model 2.1 treated the location of polluting facilities (energy category) as the independent variable and demographic indicators as the dependent variable. This resulted in mostly moderate R2 values (for Low Income, Linguistic Isolation, and Housing Cost Burden) with values closer to 1 for People of Color.
Model 2.2 treated the location of environmental hazards as the independent variable and demographic indicators as the dependent variable resulted in R2 values close to 1, indicating a good model fit. Based on these results, Model 2.2 was selected as the overall best fit.

Discussion
Results shown in Maps 14 and 15 illustrate the varying strength in association between the locations of polluting facilities and census block groups with greater percentages of non-white residents (Map 14) and low-income residents (Map 15). Both maps show an overall positive correlation indicating that in general, census block groups with greater percentage POC and low-income residents are spatially associated with polluting facilities. The strength of this association (as quantified by the geographic weighted regression) is indicated by the shade of purple. Darker purple areas have a stronger association between these two variables while lighter areas have a weaker association.
These results align with other studies that found the same or similar association. Miranda et al. (2011) explored whether the Clean Air Act and its Amendments have been equally effective in protecting the right to clean and healthy air for both affluent and disadvantaged communities in the US. This study found that “non-Hispanic Black people are consistently overrepresented in communities with the poorest air quality” and that “low income and minority communities tend to experience higher ambient pollution levels” (Miranda et al, 2011, p. 1755).
“Low income and minority communities tend to experience higher ambient pollution levels. It also appears that environmental justice concerns are more prominent along race/ethnicity lines, rather than measures of poverty.”
Miranda et al., 2011
This map could be used to investigate the types of polluting facilities present in the block groups with a high R2 value to gain further insights as to the type of hazards experienced by communities in these areas. A deeper understanding of the communities where POC and Low-Income populations face greater exposure to hazards from polluting facilities could then be used to prioritize locations across the state for pollution regulation and environmental justice initiatives.
Conclusion
In the pursuit of understanding the spatial distribution of pollution sources and its intersection with social demographics in Colorado, this atlas has unveiled significant insights into the environmental landscape of the state. The integration of diverse datasets, including pollution sources and community demographics, has allowed for a comprehensive examination of environmental justice considerations.
The mapping of pollution sources across Colorado has illuminated the geographical patterns of environmental burdens. It is evident that various communities bear the disproportionate weight of pollution facilities. These findings underscore the urgency of addressing environmental justice concerns, particularly as it pertains to the equitable distribution of environmental risks and benefits.
The exploration of community demographics, distinguishing between affluent and disadvantaged neighborhoods, has revealed a complex relationship between socio-economic status and proximity to pollution sources. Notably, the Geographic Weighted Regression (GWR) analysis has provided a nuanced perspective by indicating that communities with a high percentage of people of color and low-income communities are more likely to be situated in close proximity to pollution facilities. GWR has also allowed for a detailed examination of the ways in which this relationship varies across the state.
Another issue highlighted by this project is the need for more comprehensive monitoring systems across the state. While many of the pollution indicators used by CDPHE’s EnviroScreen incorporate empirical data from monitors, there is not a sufficient number of monitors across the state to rely on empirical data alone and so models must be constructed to interpolate values for areas without monitors. Installing a connected network of air and water quality monitors across the state - and especially in disadvantaged communities - that can reliably provide accurate data is a crucial step towards understanding and acting on environmental issues.
This project's findings reinforce the need for targeted policy interventions and advocacy efforts aimed at rectifying environmental disparities. Environmental justice considerations must be at the forefront of decision- making processes to ensure that vulnerable communities are not disproportionately burdened by the negative impacts of pollution. The GWR analysis, highlighting the spatial variability in the relationship between demographics and pollution, emphasizes the importance of localized strategies in addressing environmental injustices.
Moving forward, collaborative efforts between government agencies, advocacy groups, and affected communities are essential to foster a more just and sustainable environment for all residents of Colorado. By acknowledging the intersectionality of environmental issues and social demographics, we pave the way for a more equitable and resilient future, where environmental justice is not just a concept but a reality for every Coloradan.
Mary Straka is a recent graduate from the Master of Arts Applied Geography and Geospatial Science Program