Anna James
Introduction
Recently, many ecologists have focused their efforts on studying how urbanization impacts bird populations (Lee et al., 2021; Marques et al., 2020; Torres et al., 2016; Waltert et al., 2004). Urbanization and linear infrastructure (roads and power lines) can negatively affect bird population densities and avian species richness (total number of species at a site) (Benítez-López et al., 2010; Lee et al., 2021; Marques et al., 2020; Trammell & Bassett, 2012; Waltert et al., 2004). Studies have found that in areas with higher levels of urbanization, avian species richness (ASR) is lower (Lee et al., 2021; Waltert et al., 2004). Similarly, other studies show that major road density and proximity to linear infrastructure negatively affect ASR and overall abundance (Benítez-López et al., 2010; Torres et al., 2016; Trammell & Bassett, 2012). Studying the relationship between ASR and proximity to linear infrastructure is incredibly important for informing decisions regarding the construction of new roads and power lines in areas with little human disturbance (Benítez-López et al., 2010; Marques et al., 2020; Torres et al., 2016; Trammell & Bassett, 2012).
Proximity to forests is another factor that can help explain variation in ASR at different sites. A recent study in Indonesia found that at sites closer to forests, species richness was higher for both forest-specialist birds and insectivorous birds (Muhamad et al., 2013). As distance between the site and the forest increased, the total number of species for these two groups decreased (Muhamad et al., 2013). Additionally, recent work in France showed that forest edge habitats have high ASR and abundance compared to other habitats farther away from the forest (Terraube et al., 2016), indicating that proximity to forests may be an explanatory variable for variation in species richness.
Alongside studying how proximity to infrastructure and forests relates to ASR, studying spatial patterns in abundance is also important (Brown et al., 1995). These studies are crucial for understanding bird population dynamics and can be used to guide conservation efforts (Brown et al., 1995). The main goal of this study is to examine the relationship between ASR and distance to highways and forests/grasslands for various bird survey sites throughout Colorado. The second goal of the study is to examine how ASR values are distributed in Colorado, focusing on whether these values are spatially clustered. I chose to analyze species richness patterns rather than individual species abundance as the scale of my study is rather small, which would likely limit the detection of abundance patterns (Brown et al., 1995).
Methods
Data collection and processing
I gathered data from three sources. The first dataset is from the North American Breeding Bird Survey (BBS) Dataset, which contains “avian point count data for more than 700 North American taxa” (Pardieck et al., 2020). Once every summer, experienced volunteers walk along designated routes across North America and record all birds they see. The dataset contains the route starting locations in latitude and longitude as well as bird counting data for each survey from 1966 – 2019. The second dataset is from the Colorado Department of Transportation (CDOT) GIS and is a polyline feature class containing all highway segments CDOT oversees (Colorado DOT GIS, 2018). The third dataset is from the USDA Forest Service FSGeodata and is a polygon shapefile showing all proclaimed National Forests and National Grasslands in the United States (USDA Forest Service, 2021).
I narrowed the BBS dataset down to just Colorado data and only used routes that had data for 2018 as this was the year the highways dataset was published. For each route, I calculated species richness by totaling the species seen at each route in 2018. I removed two outliers from the dataset to make the data more normal, resulting in a total of 110 routes. In ArcGIS Pro (version 2.9), I created a point feature class of the route starting points (Figure 1) and clipped the USDA layer to the Colorado boundary using a state outline (ESRI Data and Maps, 2014). Finally, I ran two “Near” functions, one to find the nearest highway for each route starting point and another to find the nearest forest/grassland for each route starting point. I used the “NEAR_DIST” data from the resulting tables in my analyses.
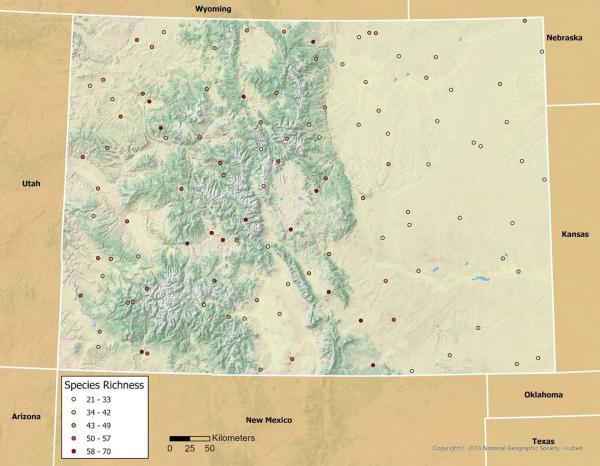
Figure 1. Route starting points and their associated ASR values for Colorado. State outline data come from the USGS National Map (U.S. Geological Survey, 2014).
Correlation analysis
To examine the relationships between a route’s species richness and proximity to highways and forests/grasslands, I conducted correlation tests. Correlation tests examine the relationship between two numerical variables and indicate the strength and direction (positive or negative) of the relationship. Strong correlations have values that are close to +/– 1 while weak relationships have values closer to 0. In RStudio (version 2021.09.1+372), I examined the three variables for normality: species richness, distance to the nearest highway, and distance to the nearest forest/grassland. Species richness was normally distributed but the two distance variables were not. As such, I ran two non-parametric Spearman’s Rho correlation tests, one examining the relationship between a route’s species richness and distance to the nearest highway and another examining the relationship between a route’s species richness and distance to the nearest forest/grassland.
| Mean Distance to the nearest highway | Mean distance to the nearest forest/grassland | |
| Group 1 | 1,533.30m | 1,334.40m |
| Group 2 | 12,478.70m | 54,885.50m |
Table 1. Mean distances for the categorical groups
T-tests
I also conducted two independent t-tests to examine the relationships between distance to a highway or forest/grassland and a route’s species richness. Independent t-tests compare the means of two groups and determine whether those means are significantly different from one another. The goal of conducting t-tests was to test the robustness of the relationship between distance to a highway or forest/grassland and a route’s species richness and see if the patterns were the same across different types of tests.
I created two categorical groups based on distance for each of the distance-related variables (distance to the nearest highway and distance to the nearest forest/grassland). I sorted both tables containing “NEAR_DIST” data so that the distances were arranged shortest to longest. For each table, I put the first 55 routes into Group 1 and the last 55 routes into Group 2 (Table 1). All groups demonstrated normality. In RStudio, I ran independent t-tests to see if the mean species richness for Groups 1 and 2 differed significantly for each of the distance-related variables.
Spatial autocorrelation
To test for spatial autocorrelation among the species richness values, I ran a Global Moran’s I test in ArcGIS Pro. The Global Moran’s I test examines the spatial distribution of the points and determines whether the values associated with those points are spatially clustered or dispersed (Moran, 1948; Chou, 1995). In a dataset exhibiting positive spatial autocorrelation, data points with similar values are spatially clustered. Conversely, in a dataset exhibiting negative spatial autocorrelation, data points with similar values appear to repel each other (Chou, 1995). For this test, I used a fixed distance band of 100km as at this distance, each route starting point had at least one neighbor.
Additionally, I ran both an Anselin Local Moran’s I analysis and a Getis Ord-Gi* Hot Spot analysis in ArcGIS Pro. These tests indicate where spatial autocorrelation occurs in the data. The Anselin Local Moran’s I analysis examines the dataset for spatial autocorrelation and reveals where high values cluster near other high values, where low values cluster near other low values, and where there are outliers in the data (where a low value is surrounded by high values, for example) (Anselin, 1995). Similarly, the Getis Ord-Gi* Hot Spot analysis identifies hot spots and cold spots (Getis & Ord, 1992). Hot spots are areas where particularly high values cluster, and cold spots are areas where particularly low values cluster. Using ArcGIS Pro, I created Thiessen polygons around each route start point using the Create Thiessen Polygons tool. I ran both an Anselin Local Moran’s I analysis and a Getis-Ord Gi* Hot Spot analysis on the Thiessen polygons, using species richness as the input field, a 100km fixed distance band, and the False Discovery Rate Correction.
Results
The main goal of this study was to see whether a route’s species richness is related to the distance from the route to the nearest highway or forest/grassland. From the correlation tests, I found that route species richness and distance to the nearest highway were not significantly correlated (Rho = –0.1229, p = 0.2007, Figure 2). Contrastingly, route species richness and distance to the nearest forest/grassland were significantly negatively correlated (Rho = –0.3768, p < 0.001, Figure 3), meaning that species richness decreases as the distance to the nearest forest or grassland increases.
The t-tests yielded similar results. Mean route species richness was not significantly different between the two groups for the distance to the nearest highway variable (t = 0.6494, df = 108, p = 0.5175, Figure 4). However, mean route species richness was significantly different between the two groups for the distance to the nearest forest/grassland variable, with Group 1 having a higher species richness than Group 2 (t = 2.9754, df = 107.19, p = 0.003617, Figure 5).

Figure 2. Species richness values plotted against distance to the nearest highway for each route.

Figure 3. Species richness values plotted against distance to the nearest forest/ grassland for each route.

Figure 4. Mean species richness for the two groups based on distance to the nearest highway. Group 1 had a mean species richness of 44.82 while Group 2 had a mean species richness of 43.45. Error bars represent the standard error of the mean.

The second goal of this study was to see if the species richness values demonstrate spatial autocorrelation. The Global Moran’s I test revealed that the species richness values exhibit positive spatial autocorrelation (Moran’s Index = 0.3135, z-score = 7.54, p < 0.001), meaning that similar ASR values are more spatially clustered than expected. The Anselin Local Moran’s I analysis showed that low species richness values are clustered in eastern Colorado and high species richness values are clustered in western Colorado (Figure 6). Similarly, the Getis-Ord Gi* Hot Spot analysis identified several cold spots (areas where low ASR values cluster spatially) in eastern Colorado and several hot spots (areas where high ASR values cluster spatially) in western Colorado (Figure 7).

Figure 6. Anselin Local Moran’s I Analysis of ASR values across Colorado. Base map data come from the USGS National Map (U.S. Geological Survey, 2014).

Figure 7. Getis-Ord Gi* Hot Spot Analysis of ASR values across Colorado. Base map data come from the USGS National Map (U.S. Geological Survey, 2014).
Limitations
One limitation of my study is that the BBS dataset only contains the route starting locations. Each route is 25 miles long and has 50 stops where the observer records bird count data (Pardieck et al., 2020). These stop locations are not included in the dataset. Species richness values likely vary along each route, with each stop having a different total number of species. Additionally, as some points on the route are likely further away from highways or forests/grasslands than the starting point is, the relationship between species richness and proximity to highways and forests/grasslands may change throughout the route. As I was only able to use route starting locations, my analysis may not represent the distribution of ASR in Colorado accurately. Future studies should include these stop locations to enhance the analysis.
Another limitation of this study was the lack of qualitative data on the forests and grasslands. Data on forest/grassland type and quality would greatly enhance the overall study as these factors often play a large role in a site’s species richness (Terraube et al., 2016). My study solely focused on distance to forests and grasslands, which, while important, may not explain all the variation in route species richness. In future work, conducting a qualitative analysis of the National Forest Service lands would be highly beneficial.
Discussion
One conclusion from this work is that in Colorado, avian species richness (ASR) is significantly and negatively related to the distance to a forest/grassland, which matches results from similar studies (Muhamad et al., 2013; Terraube et al., 2016). Routes closer to forests/grasslands had higher species richness values than routes farther away from forests/grasslands, as demonstrated by both aspatial analyses. Therefore, creating and maintaining forests and grasslands in Colorado is important for preserving high ASR. However, the correlation test showed that the relationship was not particularly strong as the Rho value was only –0.3768. As such, there are likely other factors that play a role in determining the ASR of a site, which could be analyzed in future studies.
Another conclusion is that proximity to highways was not related to ASR. These results contrast other studies that show that linear infrastructure negatively affects bird populations and ASR (Benítez-López et al., 2010; Marques et al., 2020; Torres et al., 2016; Trammell & Bassett, 2012). A possible explanation for these results is that my study only focused on highways. A recent study investigating how linear infrastructure impacts grassland bird populations demonstrated that power lines greatly impact population density and spatial distribution while roads did not have as significant of an impact (Marques et al., 2020). Therefore, while my results indicate that proximity to highways does not impact ASR in Colorado, further analysis including other types of linear infrastructure such as power lines and major roads is needed to better characterize this relationship.
Finally, the spatial autocorrelation tests revealed that ASR is low in eastern Colorado and high in western Colorado, which may be a result of habitat type and quality in these areas. Eastern Colorado is dominated by the Great Plains ecosystem, which consists of mostly grasslands and is often subject to droughts and fires, making it a harsh environment for many species (Marr, 1961; Samson et al., 2004). Additionally, the Great Plains ecosystem has undergone many anthropogenic land-use changes, all of which have negatively impacted grassland bird populations (Parton et al., 2003; Samson & Knopf, 1994). As such, low ASR values in eastern Colorado are not surprising. West of the plains lie the Rocky Mountains, an area characterized by dramatic changes in altitude and vegetation (Marr, 1961). Areas with more habitat diversity often support a wider variety of species (McCain & Grytnes, 2010), which may explain the high ASR values seen in western Colorado.
Conclusion
In this study, I analyzed the relationship between a route’s avian species richness and the distance between the route and the nearest highway or forest/grassland. The results of this study indicate that a route’s proximity to protected forests and grasslands is related to the route’s ASR value. More specifically, routes closer to protected forests and grasslands had higher ASR values. As such, these results highlight the importance of having protected wilderness areas across the state. Additionally, while the results of my study indicated no relationship between a route’s ASR and distance to the nearest highway, the potential negative effects of infrastructure development should not be ignored. Therefore, in order to best protect Colorado’s unique avian communities, we should strive to establish more protected areas and be conscious of the effects infrastructure development can have on these communities.
The second aim of the study was to examine the spatial patterns of avian species richness in Colorado. The results of my study indicate that eastern Colorado has several spots with relatively low ASR and western Colorado has several spots with relatively high ASR. In addition to showing spatial patterns of ASR, these results highlight areas where conservation efforts should be focused. Areas where there are extremely high or low ASR values should be prioritized in conservation initiatives so that we can preserve areas that are species-rich and protect areas that have fewer species. However, another analysis conducted at a finer spatial scale is needed to truly understand the spatial patterns of ASR in Colorado. This study simply begins the conversation and opens the door for further analyses of these patterns. Future analyses can help us shape avian conservation efforts in Colorado and better understand the different avian communities across the state.
Anna James is completing a graduate certificate in GIS.