Introduction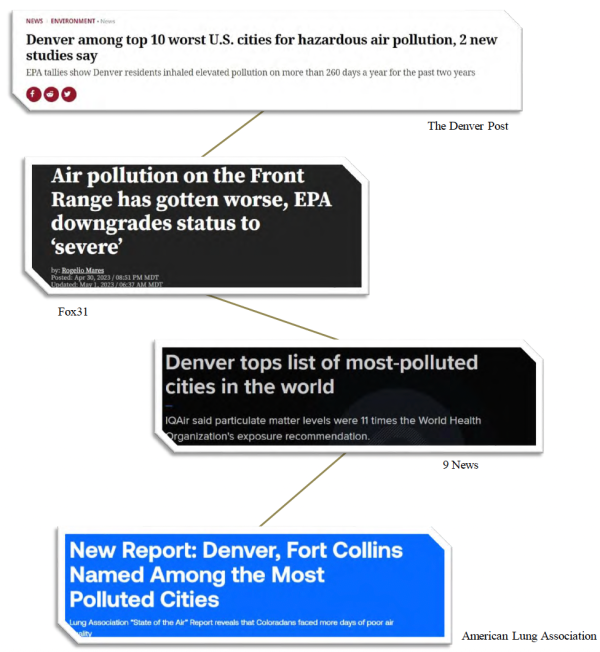

An individual may experience a respiratory illness when the passage in their lungs becomes narrow, leading to inflammation and tightness of the muscles around the airways, thus presenting subclinical adversities like cough, wheezing, shortness of breath, and chest tightness, among other symptoms (World Health Organization, 2022). Factors that influence the development of respiratory illness include a prior family history of the disease, viral respiratory infections and allergies, occupational exposure, personal behaviors like smoking, and environmental conditions such as air pollution (American Lung Association, 2023). Air pollution and urbanization are the leading factors that drive the risk of respiratory illness due to high amounts of pollutants being released near construction sites in urbanized areas (WHO, 2023; ALA, 2023). For instance, high amounts of ozone in regions of Colorado, like Denver and Fort Collins, ranked 7th and 18th, respectively, are among the “worst” in a selection of 25 cities for worst ozone pollution (ALA, 2022; The Denver Post, 2020). Meanwhile, Grand Junction, Colorado Springs, and Pueblo correlate with cleaner air (ALA, 2022).
In addition, several counties in Colorado have been flagged as “failing” in their air quality standards since 2016 due to high levels of contaminants that residents exhibit (ALA, 2022). Denver is an essential metropolitan area in Colorado, where high amounts of pollution are released, leading residents to experience worsening respiratory conditions (news citation). This is where the initial interest in this project began, with the changing dynamics of environmental conditions in Denver and its neighborhoods.
This project aims to (1) determine patterns of prevalence of asthma found in Denver neighborhoods, (2) determine what neighborhood-level traits and person-level characteristics are associated with asthma diagnosis and hospitalizations, and (3) determine if the number of polluters in Colorado correlates with asthma prevalence by county. Data was drawn primarily from surveys found in the Colorado Department of Public Health and Environment and the Environmental Protection Agency websites to answer these questions. After analyzing data from these sources, a series of maps were created to visualize asthma hospitalizations and known diagnoses of asthma, along with green space and the number of polluters around Colorado.
Literature Review
Environmental Conditions
Environmental conditions are the leading cause of respiratory illnesses, and previous literature found that living near gas drill sites (Johnston et al., 2021), waste depots, and highways (Woo et al., 2018) leads to a high release of contaminants and worsening respiratory conditions (Cook et al., 2021). There is an evident relationship where contaminants like ozone (O3) positively correlate with respiratory conditions like asthma and chronic obstructive pulmonary disease (COPD; Strosnider et al., 2018).
Other pollutants, such as particulate matter 2.5 microns in diameter (PM2.5) or 10 microns (PM10), influence respiratory health (Cook et al., 2021). Additionally, the release of carbon monoxide (CO2) from car emissions and semi-trucks, along with polluter facilities, are factors influencing ongoing environmental pollution (Johnston et al. 2021; Bailey et al. 2017).
As a result, environmental conditions are primarily driven by the release of hazardous pollutants, and individuals develop respiratory illnesses like asthma and COPD and decreased functions impacting lung capacity, among other things (Faraji et al., 2020; Zuo et al., 2019). However, individuals who reside in neighborhoods subjected to those conditions cannot control environmental conditions. However, individuals living in those areas can manage personal characteristics that enable them to either remain in those neighborhoods or migrate to a more affluent neighborhood with better living conditions and neighborhood traits.
Neighborhood and Personal Characteristics
Individual characteristics, particularly socioeconomic status (SES), influence where an individual resides (Humphrey et al., 2019). If one has a high socioeconomic status, one will live in an affluent neighborhood that enables more accessible resources and conditions that influence one's health (Woo et al. 2018). At the same time, those who reside in poor areas live in homes with deteriorating features that can worsen their respiratory health (Teixeira and Zuberi, 2018).
Socioeconomic status extends to health coverage, where individuals with high SES will be better protected and show favorable health outcomes (Coogan et al., 2016). Finally, SES and education have been measured separately or together in research. Nevertheless, the consensus of these attributes depicts better respiratory health outcomes due to engagement in healthy behaviors (exercising, less smoking, nutrition choices); the same cannot be said for individuals with lower levels of educational attainment (Shin, 2020).
Race and ethnicity also influence where an individual lives. For example, people of color may live in less desirable neighborhoods due to a lack of resources, whereas others are influenced by exposure to discrimination in the housing market process (Iceland and Wilkes, 2006). Additionally, a person of color has more difficulty obtaining resources on where to move. Therefore, they look through informal resources that can aid them in their search for potential homes (Teixeira and Zuberi, 2018). However, people of color remain in neighborhoods where there are polluters (Johnston et al., 2021) and develop some form of respiratory illness (Cook et al., 2021).
Other person-level characteristics influence the exposure to pollutants, such as an individual's age. A study by Strosnider and colleagues (2018) investigated counties in several states, including Colorado, where asthma rates tended to be higher in children. In contrast, chronic obstructive pulmonary disease (COPD) and pneumonia were found in adults 65 years old and younger. Even emergency visits due to exposure from pollutants vary by age, where there is a high correlation between children subjected to PM2.5 and emergency visits; meanwhile, adults had a moderate relationship between PM2.5 and emergency visits (Strosnider et al., 2018).
Now, looking into neighborhood-level characteristics, access to green space leads to better mental and physical health outcomes and positive physiological changes from walkability and exploration of the neighborhood (Mouratidis, 2020; Nesbitt et al., 2019). These advantages remain in affluent neighborhoods compared to poor communities where they may lack green space (Bravo et al. 2016).
Methods
Asthma Prevalence (2014-2017) Maps
Data were drawn from the 500 Cities Project to investigate asthma prevalence in Denver. This data comes from the CDC in partnership with the Robert Wood Johnson Foundation; the data looks at tract-level health determinants, such as chronic risk factors, health outcomes, and health resources given to those in those neighborhoods (CDC, 2020). The project ran between 2016 and 2019, yet the collected data is from 2014 to 2017 and represents about 33.4% of the U.S. population (CDC, 2020). For the creation of the first map, data were used from 2014 to 2017 since data availability was between those years.
The dataset contains fields with chronic respiratory issues, such as asthma and COPD. Other data included in the analysis of the four maps include geographic shapefiles, such as tract and city boundaries and city point locations. The first four maps were created using tract and city boundaries and the 500 Cities Project data.
To create the maps, tract, city boundaries, and 500 Cities Project were changed from the default coordinate system to the NAD 1983 StatePlane Colorado Central FIPS 0502 (Meters).
The 500 cities project was symbolized as a graduated map; areas with high prevalence were dark brown, and areas with low prevalence were shaded in a lighter color. The percent prevalence categories resulted from the Jenks method and were consistent across all four maps.
The importance of the Asthma Prevalence (2014-2017) Maps is to show a descriptive image of the changes happening in neighborhoods around Denver.

Source: Colorado Department of Public Health and Environment
Denver Asthma Hospitalizations & Known Diagnosed Asthma Maps
Hospitalization data were gathered from the Colorado Hospital Association and its Hospital Discharge dataset from 2015-2019, which was accessed through the Colorado Department of Public Health and Environment (CDPHE). The Known Asthma Diagnosis data were gathered from the Behavioral Risk Factor Surveillance System (BRFSS; 2014-2017) and included demographic information from the American Community Survey (ACS; 2013-2017). Both datasets are found on the CDPHE open data website.
This series of maps reused the cities and boundaries shapefiles from the previous maps. The parks shapefile was retrieved from the Denver government website; the parks in this dataset represented in the maps contain parks, golf courses, and recreation areas.
Tract data for both datasets were switched coordinate system NAD 1983 StatePlane Colorado Central FIPS 0502 (Meters). Then, the data sets were clipped to the Denver boundary, and the hospitalizations and diagnosis maps were symbolized the same way as the prevalence maps, with darker brown areas showing higher asthma hospitalizations and diagnoses; for the park maps, they were symbolized with graduated symbols, with a dark red indicating more hospitalizations per 100,000. The categories remain in the Jenks method for all maps, and five categories are used instead of four.

Source: Colorado Department of Public Health and Environment & Denver.gov
Spatial Analysis Maps of Hospitalizations and Known Diagnosed Asthma
The initial maps of hospitalizations and asthma diagnoses were created to visualize their correlation with Denver neighborhoods and answer the second question. As a result, additional maps were created to answer the second question.
Additional data from the CDPHE were gathered from the Colorado Enviroscreen dataset, containing Census tract information. The data includes index scores for various factors affecting neighborhoods and demographics. One of the difficulties of using this dataset is that its metadata is difficult to access. As a result, the data primarily used were more demographic than index attributes. This leads to the creation of maps with hospitalizations and diagnoses where tracts are 50% or more of people of color.
Spatially joined maps were created by determining where 9% or more of individuals have been diagnosed with asthma and then finding tracts where 50% or more people of color live. After selecting both attributes, a new shape file was created to narrow down neighborhoods. The same was done for asthma hospitalizations and neighborhoods where 50% or more of people of color live.
The additional map looks at health coverage and those who live below the poverty line; health coverage data was gathered from the CDPHE website, and the data contains averages of those with health coverage from different years of the BRFSS survey between 2014 and 2017; this is a separate file. Below-the-poverty-line data was also a separate file from the CDPHE, which takes estimates from the ACS between 2015 and 2019 and makes an average.
Neighborhoods with 70% or more healthcare coverage were selected to combine with asthma hospitalizations. The same process was used to select 20% or more individuals who live in neighborhoods below the poverty line and intersect them with the percentage of adults diagnosed with asthma. Symbology remains the same as in previous maps.
The selection of joins was spatial, and the reason to conduct spatial join in the additional maps was to demonstrate factors that can potentially affect the hospitalizations and diagnosis of asthma, especially when comparing factors such as income and health insurance, as well as looking at the race and ethnic that people live in those neighborhoods.
Denver Neighborhoods Where 50% or more are People of Color by Percent Diagnosed with Asthma

Neighborhoods in north Denver have a high number of adults who have been diagnosed with asthma, where 50% + who reside are people of color.
Denver Neighborhoods where 50% or more are People of Color by Ashtma Hospitalizations

The north of Denver continues to be subjected to respiratory conditions, where asthma hospitalizations range between 1142 and 1666 cases. However, cases in the west of Denver appear, but unlike the previous map, there was little to no presence of adults diagnosed with asthma.
Source: Colorado Department of Public Health and Environment
Denver Asthma Hospitalizations Were 70% and Above Have Health Care Coverage


There is no visual correlation between hospitalizations and health coverage. However, in a couple of neighborhoods with higher hospitalizations, there tends to be lower healthcare coverage. For instance, in the west of Denver, there are high levels of asthma hospitalizations, but the neighborhood is not fully insured.
Source: Colorado Department of Public Health and Environment
Percent of Adults Diagnosed with Asthma & Are Above 20% Below The Poverty Line


Income in the following map is represented as people below the poverty line. Looking at the percentage of adults diagnosed with asthma and where neighborhoods are below the poverty line, There are no patterns of adults diagnosed with asthma in neighborhoods where residents are below the poverty line.
Source: Colorado Department of Public Health and Environment
Hazardous Polluters in Colorado Map
The data used to create the polluter map was derived from the Environmental Protection Agency (EPA), which contains the Facility Registry Service (FRS) data as a geodatabase; this dataset includes records of facilities that release pollutants. After downloading the data, the specific shapefile used is the EIS, known as the Emission Inventory System, containing dotted points of all polluter facilities in the U.S. that are permanently closed or active. The data was clipped to the state boundary.
The coordinate system was changed similarly to the previous maps. After changing the data projection, the FRS EIS had multiple selections of air pollution attributes; the one for this map was selected to include high and hazardous air pollution. The new selection led to using the Clip tool to place it on the state boundary.
Only active polluters were selected for this map, and polluters that had been permanently closed were removed.
Buffers were added to the polluters to visualize how far pollution extends. The selection of the colors indicates the degree to which someone is safe from pollution. Areas in yellow represent pollution that still reaches those areas, orange being moderate, and the main polluted areas in red.
Polluters were symbolized in grey, with a building representing the facility. Data about asthma prevalence among adults was added from the CDPHE. The symbology of using light to dark brown remains the same as the previous maps, and the Jenks method remains the same but is categorized into five. Moreover, it pertains to percentages of the number of asthma prevalence in the counties.
All maps in this project were made with ArcGIS Pro and accessed through the University of Colorado Denver.
Hazardous Polluters in Colorado by Adult Asthma Prevalence (County)

Source: Colorado Department of Public Health and Environment & Environmental Protection Agency
Discussion

As local news sites suggest, Denver is becoming a place where higher pollution levels affect the metropolitan area (Fox 31, 2023; 9news, 2021). The purpose of this project was to determine pollution patterns across Denver County and determine if any neighborhood- and person-level characteristics are associated with asthma diagnosis and hospitalizations.
The current project results in mixed findings regarding the questions initially set. First, by visualizing asthma prevalence in Denver between 2014 and 2017, Denver neighborhoods in the north resulted in higher asthma prevalence. In contrast, in the south of Denver, asthma prevalence was lower in those areas. By 2017, all neighborhoods, except four, indicate higher asthma prevalence than in previous years. As a result, asthma prevalence patterns are found in Denver neighborhoods.
Next, neighborhood- and person-level characteristics were used to determine how hospitalizations and asthma diagnoses differed; there was no relationship among those items except for the people of color who reside in neighborhoods north of Denver. Thus, neighborhoods, where 50% + of people of color reside, indicate high asthma prevalence. It could be that these neighborhoods in the north are close to Highway I-70; the toxins released from semi-trucks and cars passing through could influence higher hospitalizations and diagnoses in that area (Woo et al., 2018).
Finally, it is unclear whether the number of polluters in Colorado influences exposure to hazardous contaminants. The final map serves as a visual representation of the polluters that could affect Colorado counties and the prevalence of asthma. However, there does not appear to be an association between the number of polluters in a county and asthma prevalence. For instance, counties like Huerfano, Prowers, and Baca all indicate high asthma prevalence, yet there are no polluters in those counties.
Limitations
This project has several limitations. First, question two was not fully investigated since there was no data regarding construction projects in Denver neighborhoods, thus eliminating gentrification as a possible neighborhood characteristic. The same occurred to person-level characteristics. Second, the data sets were limited to specific periods, limiting the scope of the time change in asthma prevalence.
Third, the final map presented does not accurately depict the extension of the buffers. PM2.5 and other pollutants tend to extend several hundreds of miles; when running these into ArcGIS, the buffers were all over Colorado. As a result, to see the actual representation, one must zoom into the map in the software to see the 5–10-mile radius buffers being accurately representative.
Lastly, the representation of characteristics could be better depicted by finding more data that does not restrict some person-level characteristics, such as household income and health coverage, along with new attributes like nativity.
Conclusion
In sum, patterns of asthma prevalence shifted in Denver between 2014 and 2017, with more neighborhoods indicating higher asthma prevalence as time progressed. Where only neighborhood characteristics like the percentage of people of color that reside in a neighborhood correlate with higher percentages of residents diagnosed with asthma. There were no associations between polluters and the prevalence of asthma in neighborhoods. However, the following steps would be to find data that carries information regarding pollutants and details of respiratory illnesses at the neighborhood level and conduct more analysis of active polluters.
Jose Puente Puente is a Master of Arts student in Sociology.