Pakistan: A Geographic View
This map provides a detailed geographic view of Pakistan and surrounding regions, highlighting its administrative divisions, major cities, rivers, and areas of territorial dispute. The main map outlines Pakistan's international borders with India, China, Afghanistan, and Iran, and its coastline along the Arabian Sea.
Pakistan is divided into six administrative regions (provinces and territories): Punjab, Sindh, Balochistan, Khyber Pakhtunkhwa, Gilgit Baltistan, and Azad Kashmir, with the capital territory of Islamabad also marked. Major cities such as Karachi, Lahore, Islamabad, Peshawar, Quetta, Multan, Faisalabad, Hyderabad, and Rawalpindi are labeled.
The Indus River is prominently featured, running from the north through Gilgit Baltistan and flowing south through Punjab and Sindh into the Arabian Sea. Its tributaries are also shown.
A shaded gray box in the upper left provides geographic and climatic details:
- Pakistan has a population of approximately 237.58 million, making it the fifth-most populous country in the world.
- It covers a total area of 881,912 km².
- The capital territory is Islamabad.
- The Himalayan Mountains are located in the western section.
- Pakistan has diverse climates, including:
- High humidity in coastal areas,
- Extremely cold winters in the northwestern Himalayas,
- Hot summers in the Indus valley plains,
- Monsoon rains in late summer.
Another gray box on the right explains territorial disputes stemming from the British Empire's partition of the Indian subcontinent:
- Pakistan-administered territories: Gilgit Baltistan and Azad Kashmir.
- India-administered territories: Jammu and Kashmir.
- China-administered territory: Aksai Chin.
- The Siachen Glacier is claimed by both India and Pakistan.
In the bottom-right corner, there is an inset locator map showing Pakistan highlighted in green within a broader map of South and Central Asia, including parts of India, China, Iran, Saudi Arabia, and Afghanistan.
Sources are cited from Natural Earth, the U.S. Department of State, and the World Population Review. The map uses WGS 1984 UTM Zone 42N as the coordinate system and was created by Antonio Luna, UC Denver.
Most Populated Cities and Population Density by District in Pakistan
This map shows Pakistan with color-coded population density by district and marks the most populated cities using green circular symbols. The title reads: "Most Populated Cities and Population Density by District in Pakistan".
Population Density Legend (persons per km²):
- Pale yellow: 0–50
- Light yellow: 51–100
- Light orange: 101–250
- Medium orange: 251–500
- Orange-red: 501–750
- Dark orange: 751–1,000
- Deep brown: 1,001+
Most of the high-density areas are concentrated in Punjab and Sindh provinces, particularly around Lahore, Faisalabad, Multan, Gujranwala, Rawalpindi, and Karachi.
City Population Symbols:
Cities are represented by circular icons scaled by population size, ranging from 500,000 to 10 million+.
Cities with population over 1 million (listed in gray box):
- Karachi: 16,624,219 (7th most populated city in the world)
- Lahore: 6,310,888
- Faisalabad: 2,506,595
- Rawalpindi: 1,743,101
- Multan: 1,437,230
- Hyderabad: 1,386,330
- Gujranwala: 1,384,471
- Peshawar: 1,218,773
Other Map Elements:
- A compass rose is placed in the top right corner indicating North.
- A scale bar in the lower-left shows distance in kilometers and miles.
- A gray inset box on the bottom right provides population context:
- Pakistan is the fifth-most populous country.
- It has 169 districts.
- Current growth rate: 1.91%.
- Projected to surpass 245 million by 2030 and 300 million by 2050.
Sources:
- Natural Earth
- World Population Review (2022)
Map created by Antonio Luna, UC Denver, using coordinate system WGS 1984 UTM Zone 42N.
The four maps of Pakistan show floodwater extents
The image contains four maps of Pakistan, each representing the extent of flood water for a different month during the year 2022. The maps are arranged in a 2x2 grid. Each map uses shades of blue to indicate the presence of floodwaters across the country, overlaid on a grayscale topographic base map. Major rivers and water bodies are depicted, with flood-affected areas in varying intensities of blue.
Top Left Map:
- Title: "Flood Water Extent – July, 2022 – Pakistan"
- Shows moderate flooding primarily in the southern and southeastern regions, with some scattered patches of water in central and northern Pakistan.
- Blue areas are noticeable in Sindh and Balochistan provinces.
Top Right Map:
- Title: "Flood Water Extent – August, 2022 – Pakistan"
- Depicts a significant increase in flooding compared to July.
- Large areas in Sindh, southern Punjab, and parts of Balochistan are inundated.
- New flood patches appear in northern and central parts, following river systems.
Bottom Left Map:
- Title: "Flood Water Extent – September, 2022 – Pakistan"
- Flooding is at its peak here, with widespread inundation across southern and central Pakistan.
- A massive swath of blue covers most of Sindh and southern Punjab, reaching into Balochistan.
- Floodwaters appear to extend along the course of the Indus River and its tributaries.
Bottom Right Map:
- Title: "Flood Water Extent – October, 2022 – Pakistan"
- Shows a receding of floodwaters compared to September, although large areas in the south remain flooded.
- Smaller, scattered patches persist in the central and northern regions.
Common Elements:
- All maps use a consistent scale: 0–320 kilometers (or 0–200 miles).
- The maps are annotated with a legend, source credits, and the coordinate system used: WGS 1984 UTM Zone 42N.
- Sources listed include:
- Natural Earth, 2022 (for downloadable base maps)
- UNOSAT (United Nations Satellite Centre), 2022 (for flood analysis)
People Affected by Monsoon Floods in Pakistan, 2022
The image is a detailed map of Pakistan showing the percentage of population exposed to monsoon floods in 2022, along with major urban centers represented by circles indicating population size. The map also includes annotations and statistics on the flood's human and economic impact.
Map Elements:
Population Exposed (Color Gradient):
The districts are shaded in different colors to show the percentage of population exposed to flooding:
- Light Yellow (0.0 to 4.2%)
- Light Orange (4.3 to 12.7%)
- Orange (12.8 to 29.4%)
- Dark Orange (29.5 to 57.8%)
- Dark Brown (57.9 to 91.3%)
- High exposure areas (dark brown and dark orange) are concentrated in southern and eastern Pakistan, particularly in Sindh and Balochistan provinces.
- Central and northern districts show lower population exposure (yellow/light orange).
Population Range Circles:
Cities are marked with purple circles whose size reflects population size, based on 2022 data:
- < 500,000
- 500,001 – 1,000,000
- 1,000,001 – 5,000,000
- 5,000,001 – 10,000,000
- 10,000,001+
Notable cities shown include:
- Karachi, Lahore, Faisalabad, Rawalpindi, Islamabad, Peshawar, Quetta, Multan, Hyderabad, Sukkur, Larkana, Rahim Yar Khan, Sheikhupura, Gujranwala, and Sialkot.
Flood Affected Areas:
- Sindh province appears most affected, with nearly entire districts exposed (mostly in dark brown and dark orange).
- Balochistan also shows significant exposure.
- Central Punjab and parts of Khyber Pakhtunkhwa show moderate impact.
Geographical Features:
- Major rivers are outlined in blue, especially the Indus River running north to south.
- Borders with India, Afghanistan, Iran, and China are marked.
- The Arabian Sea borders the southern coastline.
- A compass rose shows orientation (North is up).
Statistical Summary (Right Sidebar):
- 94 districts declared as "calamity hit" by October 2022.
- 19 out of the 25 poorest districts were among those declared "calamity hit".
- Over 33 million people directly affected by floods and monsoon rains.
- Close to 15 million in Sindh.
- Close to 10 million in Balochistan.
- Around 8 million people displaced.
- Over 1,700 deaths and 13,000 injuries reported.
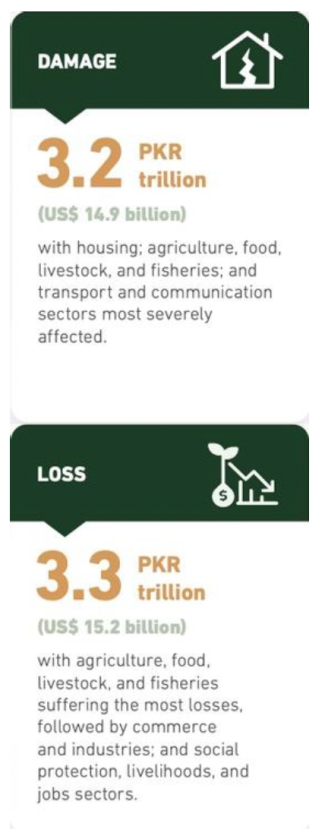
- Estimated $15 billion in damages to:
- Housing, education, energy, infrastructure.
- Additional $15 billion in losses to:
- Food/agriculture, water resources, tourism, commerce, and industry.
Map Credits:
- Antonio Luna, UC Denver
- Coordinate system: WGS 1984 UTM Zone 42N
- Data sources:
- Natural Earth (2022)
- PDMA Losses & Damages Reports (2022)
- UNOSAT Analysis (2022)
- World Population Review (2022)
Four maps of Pakistan depict disaster impact
The image contains four separate maps organized in a 2x2 grid, each representing a different aspect of flood damage in Pakistan during 2022. The top two maps show nationwide provincial-level data, while the bottom two maps focus specifically on Sindh province.
Top Left Map: “Houses Destroyed by Province”
- Color-coded in shades of red based on the number of houses destroyed.
- Legend (house destruction by province):
- 0 to 25,000 (light pink)
- 25,001 to 100,000 (light red)
- 100,001 to 250,000 (medium red)
- 250,001 to 716,819 (dark red)
- Sindh and Balochistan show the darkest red, indicating the most severe destruction, with Sindh at the highest end.
- Punjab and Khyber Pakhtunkhwa (KP) show moderate to low levels.
- Gilgit-Baltistan, Islamabad, and Azad Kashmir are not color-shaded (no significant damage reported or data not available).
Top Right Map: “Livestock Damage by Province”
- Color-coded in shades of purple to indicate the number of livestock lost.
- Legend (livestock losses by province):
- 0 to 10,000 (light lavender)
- 10,001 to 100,000 (light purple)
- 100,001 to 250,000 (medium purple)
- 250,001 to 500,000+ (dark purple)
- Sindh shows the darkest purple, indicating over 250,000 livestock lost.
- Balochistan also shows severe damage (second darkest shade).
- Punjab and KP show moderate losses.
- Northern areas are either not shaded or minimally affected.
Bottom Left Map: “Houses Destroyed in Sindh Province”
- Zoomed-in view of Sindh with district-level data.
- Color-coded in shades of red indicating house destruction:
- 0 to 10,000 (lightest pink)
- 10,001 to 20,000
- 20,001 to 50,000
- 50,001 to 100,000
- 100,001 to 120,500 (darkest red)
- Larkana and surrounding districts show the most damage, followed by central districts near Hyderabad.
- Southern districts near Karachi show the least damage.
Bottom Right Map: “Crops Damaged in Sindh Province (in acres)”
- Same geographic scale as the bottom left map but uses shades of green.
- Legend (acres of crop damage):
- 0 to 50,000 (light yellow-green)
- 50,001 to 100,000
- 100,001 to 200,000
- 200,001 to 300,000
- 300,001 to 356,582 (dark green)
- No data (grey)
- Most severely affected agricultural districts (dark green) are in central and northern Sindh, including Sukkur and Larkana.
- Karachi district is shown in grey, indicating no data.
Common Elements:
- Cities such as Karachi, Hyderabad, Larkana, and Sukkur are marked with black dots.
- All maps cite sources including:
- Natural Earth (2022) for basemaps
- PDMA Losses & Damages Reports (2022)
- UNOSAT Analysis (2022)
- Coordinate system: WGS 1984 UTM Zone 42N
- Maps created by Antonio Luna, UC Denver